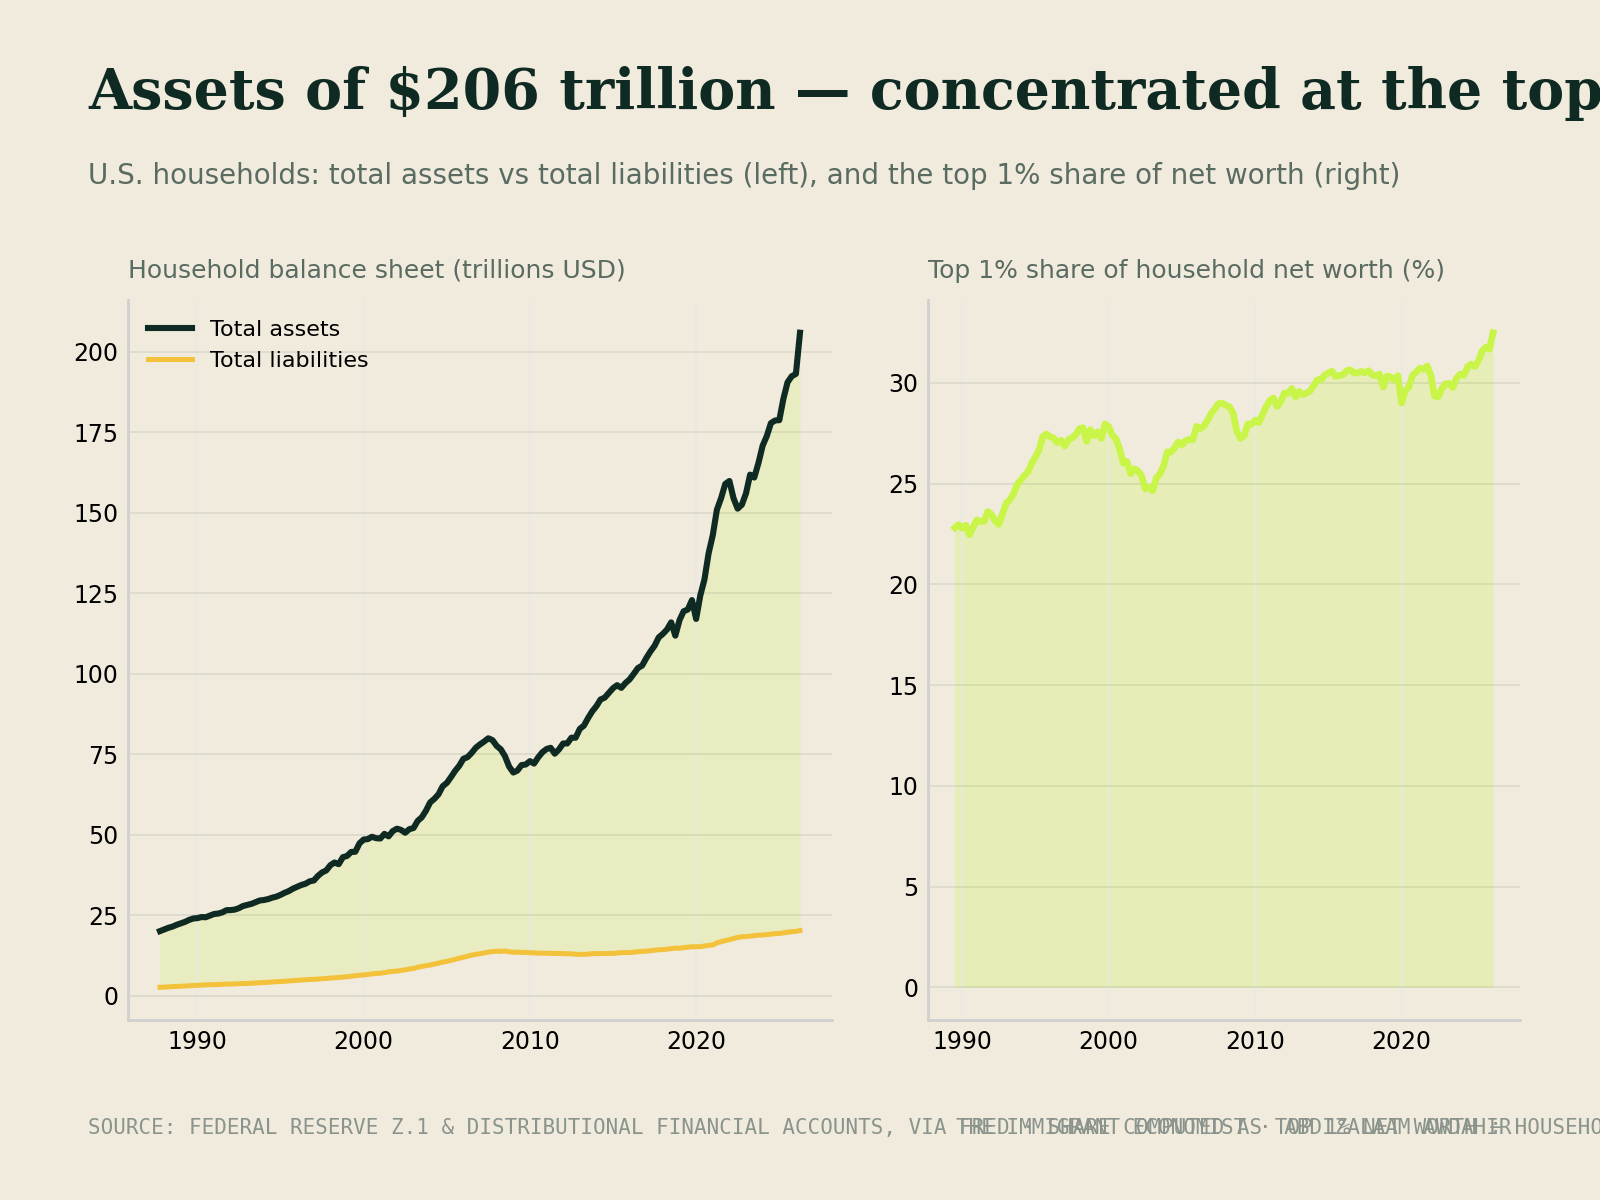
Every so often a chart crosses my feed that looks like good news — and is, partly. This one comes from the Federal Reserve's Financial Accounts, summarized in J.P. Morgan's Guide to the Markets: the combined balance sheet of every American household at the end of 2025. On one side, $205.6 trillion in assets. On the other, $21.5 trillion in liabilities. Debts are roughly a tenth of what households own. As a country, that is a remarkably solvent picture.
But I want to sit with this chart a little longer than the headline does, because averages are polite liars. A balance sheet that adds everyone together tells you how much the system owns. It does not tell you who owns it. And once you split the chart apart, the story becomes less about national wealth and more about which side of the ownership line your family is standing on.
Source: Federal Reserve Z.1 Financial Accounts, via J.P. Morgan Asset Management Guide to the Markets.
Reading the chart honestly
Start with the assets. The biggest block, 46%, is 'other financial assets' — stocks, mutual funds, bonds, ownership stakes in private businesses. Homes are 25%. Pension funds and retirement accounts are 17%. Bank deposits, the money most people think of as 'savings,' are only 7%. In other words, the bulk of household wealth is not cash and not even houses; it is ownership of productive things.
Now the liabilities. Mortgages are 67% of all household debt. Student loans, auto loans, credit cards and everything else share the remaining third. Credit card balances get the headlines, but the mortgage is the debt that actually shapes household finances. Two takeaways so far, both fair: the system as a whole is not over-leveraged, and the biggest pool of wealth is financial ownership.
Who actually owns the 46%
Here is where the average breaks. According to the Federal Reserve's Distributional Financial Accounts, the top 1% of U.S. households hold roughly 31% of all household wealth. The next 9% hold about 36%. The middle 40% hold around 30%. The bottom half of the country — tens of millions of families — hold only about 2 to 3%.
That is not a moral statement; it is an arithmetic one. It means the giant 'other financial assets' block on the chart is overwhelmingly owned by a small share of households, while the debt side is spread much more widely.
Source: Federal Reserve Distributional Financial Accounts, recent quarters. Figures rounded.
Two different balance sheets wearing one coat
The composition of wealth changes as much as the size. For the top 1%, stocks, funds and private businesses make up the majority of what they own; real estate is a minority of the portfolio, and debt is small relative to assets. Households in the rest of the top 10% look more blended — meaningful investment accounts alongside valuable homes and manageable mortgages.
For the middle class and the bottom half, the chart is almost upside down. Their wealth is concentrated in the family home, retirement accounts, and cars. Their debt is concentrated in the mortgage, plus student and auto loans. So when the market rises 20% in a year, one group's balance sheet compounds while the other's barely notices — because one group owns the thing that rose.
Source: Federal Reserve Distributional Financial Accounts. Rounded; categories simplified.
The balanced view: what this does and doesn't prove
I want to be fair here, because this topic attracts strong opinions. Capital tends to grow faster than wages over long stretches, and that does favor people who already own it. But a few honest caveats belong next to that claim. Wealth statistics count assets, not things like Social Security or public pension entitlements, which matter enormously to middle-income retirees. Many people in the 'bottom 50%' are simply young — at the start of their earning and saving lives — and move up over time. And home equity, while not as fast-compounding as stocks, has been the single most reliable wealth builder for ordinary families for generations, precisely because the mortgage forces saving.
So the lesson isn't that homes are bad or that the system is rigged beyond repair. It's narrower and more useful: wealth that compounds on its own comes from owning productive assets, and most families own too few of them, too late.
Canada and the United States: cousins, not twins
Readers north of the border often ask how this compares at home. Broadly, wealth in Canada is somewhat less concentrated: the Parliamentary Budget Officer estimates the top 1% of Canadian families hold roughly a quarter of net wealth, compared with about 31% in the U.S. That's still a large share — but a noticeably flatter distribution.
The bigger difference is housing and debt. Canadian households lean much harder on real estate for their wealth, and they borrow more to get it. Statistics Canada puts household debt at around $1.75 for every dollar of disposable income, versus roughly $1.00 in the U.S. Canadian mortgages also typically renew every five years or so, while many Americans lock a 30-year fixed rate — which means Canadian families feel interest-rate changes much faster. On the brighter side, lower tuition and strong home appreciation have historically helped younger Canadians build net worth earlier than many American peers carrying heavy student loans.
Sources: Statistics Canada (Table 38-10-0235-01); Federal Reserve / BEA for the U.S. Approximate, recent years.
What I take from all this
Three things. First, at the national level, households are solvent — the sky is not falling. Second, the average hides concentration: the assets cluster at the top, while debt is borne widely. Third, the single biggest bucket of wealth on the chart is financial ownership, and the path into it is open to anyone with a brokerage account, patience, and a monthly habit. You do not need to be in the top 1% to own a slice of the same companies they own. A broad, Sharia-screened index fund gives you that slice for a modest amount.
Putting our children on the ownership side
If there is one shift I want for the next generation, it is from saving to owning. Cash sitting in a deposit account quietly loses ground to inflation; productive assets have historically outrun it. So teach children early what it means to own a piece of a business — through index funds, and through conversations at the dinner table about where money comes from and where it goes.
Use the accounts governments hand you. In Canada, the RESP adds grant money (the CESG) on top of your contributions and lets it grow sheltered from tax; in the U.S., 529 plans do similar work for education. Start small, but start early — time is the one asset children have in abundance.
And above all, give them a framework rather than just an inheritance: spend less than you earn, own productive things, avoid debt that funds consumption, and understand risk before taking it. A family that passes on that habit is quietly moving itself, one generation at a time, from the liabilities side of the chart to the assets side. That is the whole quiet project.
Data notes: balance-sheet figures from the Federal Reserve Z.1 Financial Accounts (Q4 2025, via J.P. Morgan Asset Management). Distribution figures from the Federal Reserve Distributional Financial Accounts; Canadian figures from the Parliamentary Budget Officer and Statistics Canada. All shares rounded and approximate. This is education, not personal financial advice.
Enjoyed this? It's also on