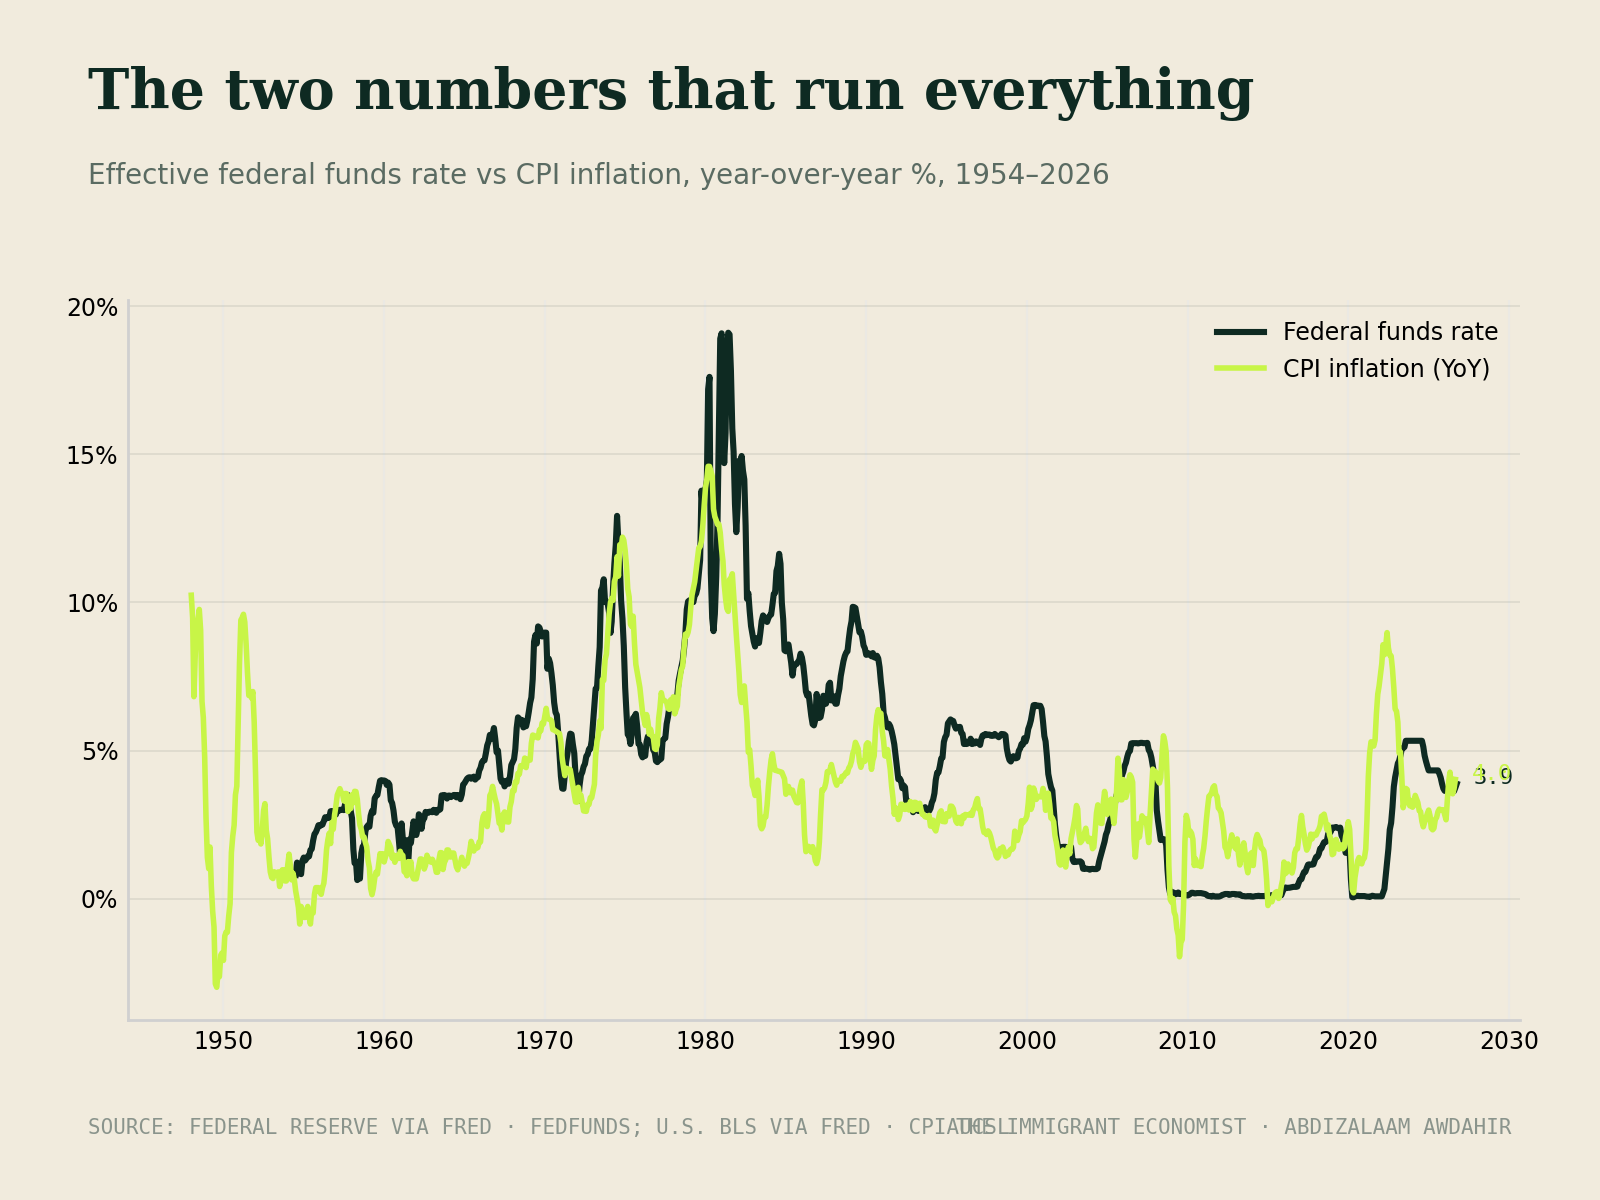
Every few weeks someone sends me a chart — inflation, unemployment, some yield curve doing something dramatic — and asks what I think it means for their money. I usually give an unsatisfying answer: probably less than you think. Not because those numbers don't matter, but because by the time a statistic is on everyone's screen, the market has been trading around it for months. The number is the news. The positioning already happened.
So over the years I've stripped my own dashboard down to two things, and I want to share them because they've saved me from a hundred distractions. Two numbers, checked occasionally, that tell me more about market structure than a hundred headlines. Fair warning: this is going to sound too simple. Simple is the point.
Number one: liquidity, not rates
Everyone watches interest rates because they're announced at press conferences. But rates are the price of money; liquidity is the amount of it actually flowing through the system — central bank balance sheets, bank reserves, credit conditions. Risk assets don't really care what the press conference said. They care whether there's more cash sloshing through the plumbing this quarter than last.
You can watch this for free: central bank balance sheet totals are published publicly, and credit spreads — the extra yield lenders demand to lend to weaker borrowers — are a live mood ring for the system. Liquidity rising and spreads calm? The wind is at your back; trend-following works, dips get bought. Liquidity draining and spreads creeping wider? Tighten up, be pickier, let the small bets stay small. I don't trade every wiggle in these. I use them to set my posture, the way you'd dress for the season rather than the hour.
Number two: breadth
The second number answers a question prices alone can't: is this move real? An index rising on broad participation — most stocks above their long-term averages, new highs outnumbering new lows — is a healthy crowd. An index rising on five names while the rest sag is a few people carrying a heavy table. Both look identical on the headline chart. Only breadth tells them apart.
When breadth confirms the trend, I stay out of my own way. When it diverges — prices up, participation down — I don't panic, but I do the two things that cost nothing and save everything: I stop adding risk, and I check that the safe end of my barbell is fully stocked. Ninety percent of good trading, in my experience, is knowing which days deserve action. Most days don't.
What this dashboard is for — and what it isn't
Let me be clear about the scope, because I owe you honesty over excitement. These two numbers guide the small, speculative end of my portfolio — the trading ideas, the timing of adds and trims. My core wealth-building never touches this dashboard at all. The halal index funds get their automatic contribution every month whether breadth is beautiful or ugly, because the twenty-year trend of productive businesses matters infinitely more than this quarter's internals.
And everything I trade, I trade the way I've committed to on this site: screened names only, no interest-based products, positions small enough that being wrong is a tuition payment rather than a catastrophe. The dashboard helps me read the tape. The principles decide whether I'm allowed to act on what I read. Keep those two in the right order, and the market stops being a casino that happens to have charts — it becomes what it actually is: a place where patient, structured people slowly collect what impatient people leave behind.
A quick note, always worth repeating: this is my personal journal, not financial advice. My positions are sized to survive being wrong, and everything I invest in passes Sharia screening — your situation is yours, so please do your own homework before acting on anything here.
This note is also discussed on